PhD Thesis
Selected graphics from dissertation, “The Characterization of Larval Homology: transcriptomic insights into the origin and evolution of animal life cycles (2017).
Genome and transcriptome comparison across the animal kingdom, illustrating gene gain (green) and gene loss (red) in each taxonomic grouping.

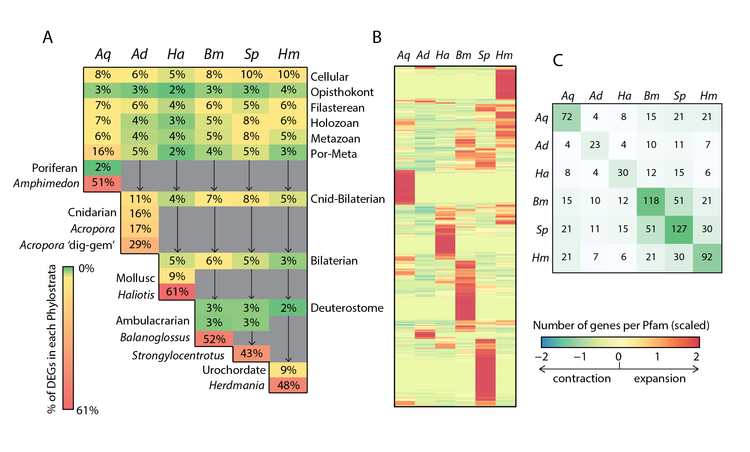
Comparison of (A) differentially expressed genes, (B) gene family expansions and (C) transcriptoin factor abundance between sampled taxa.

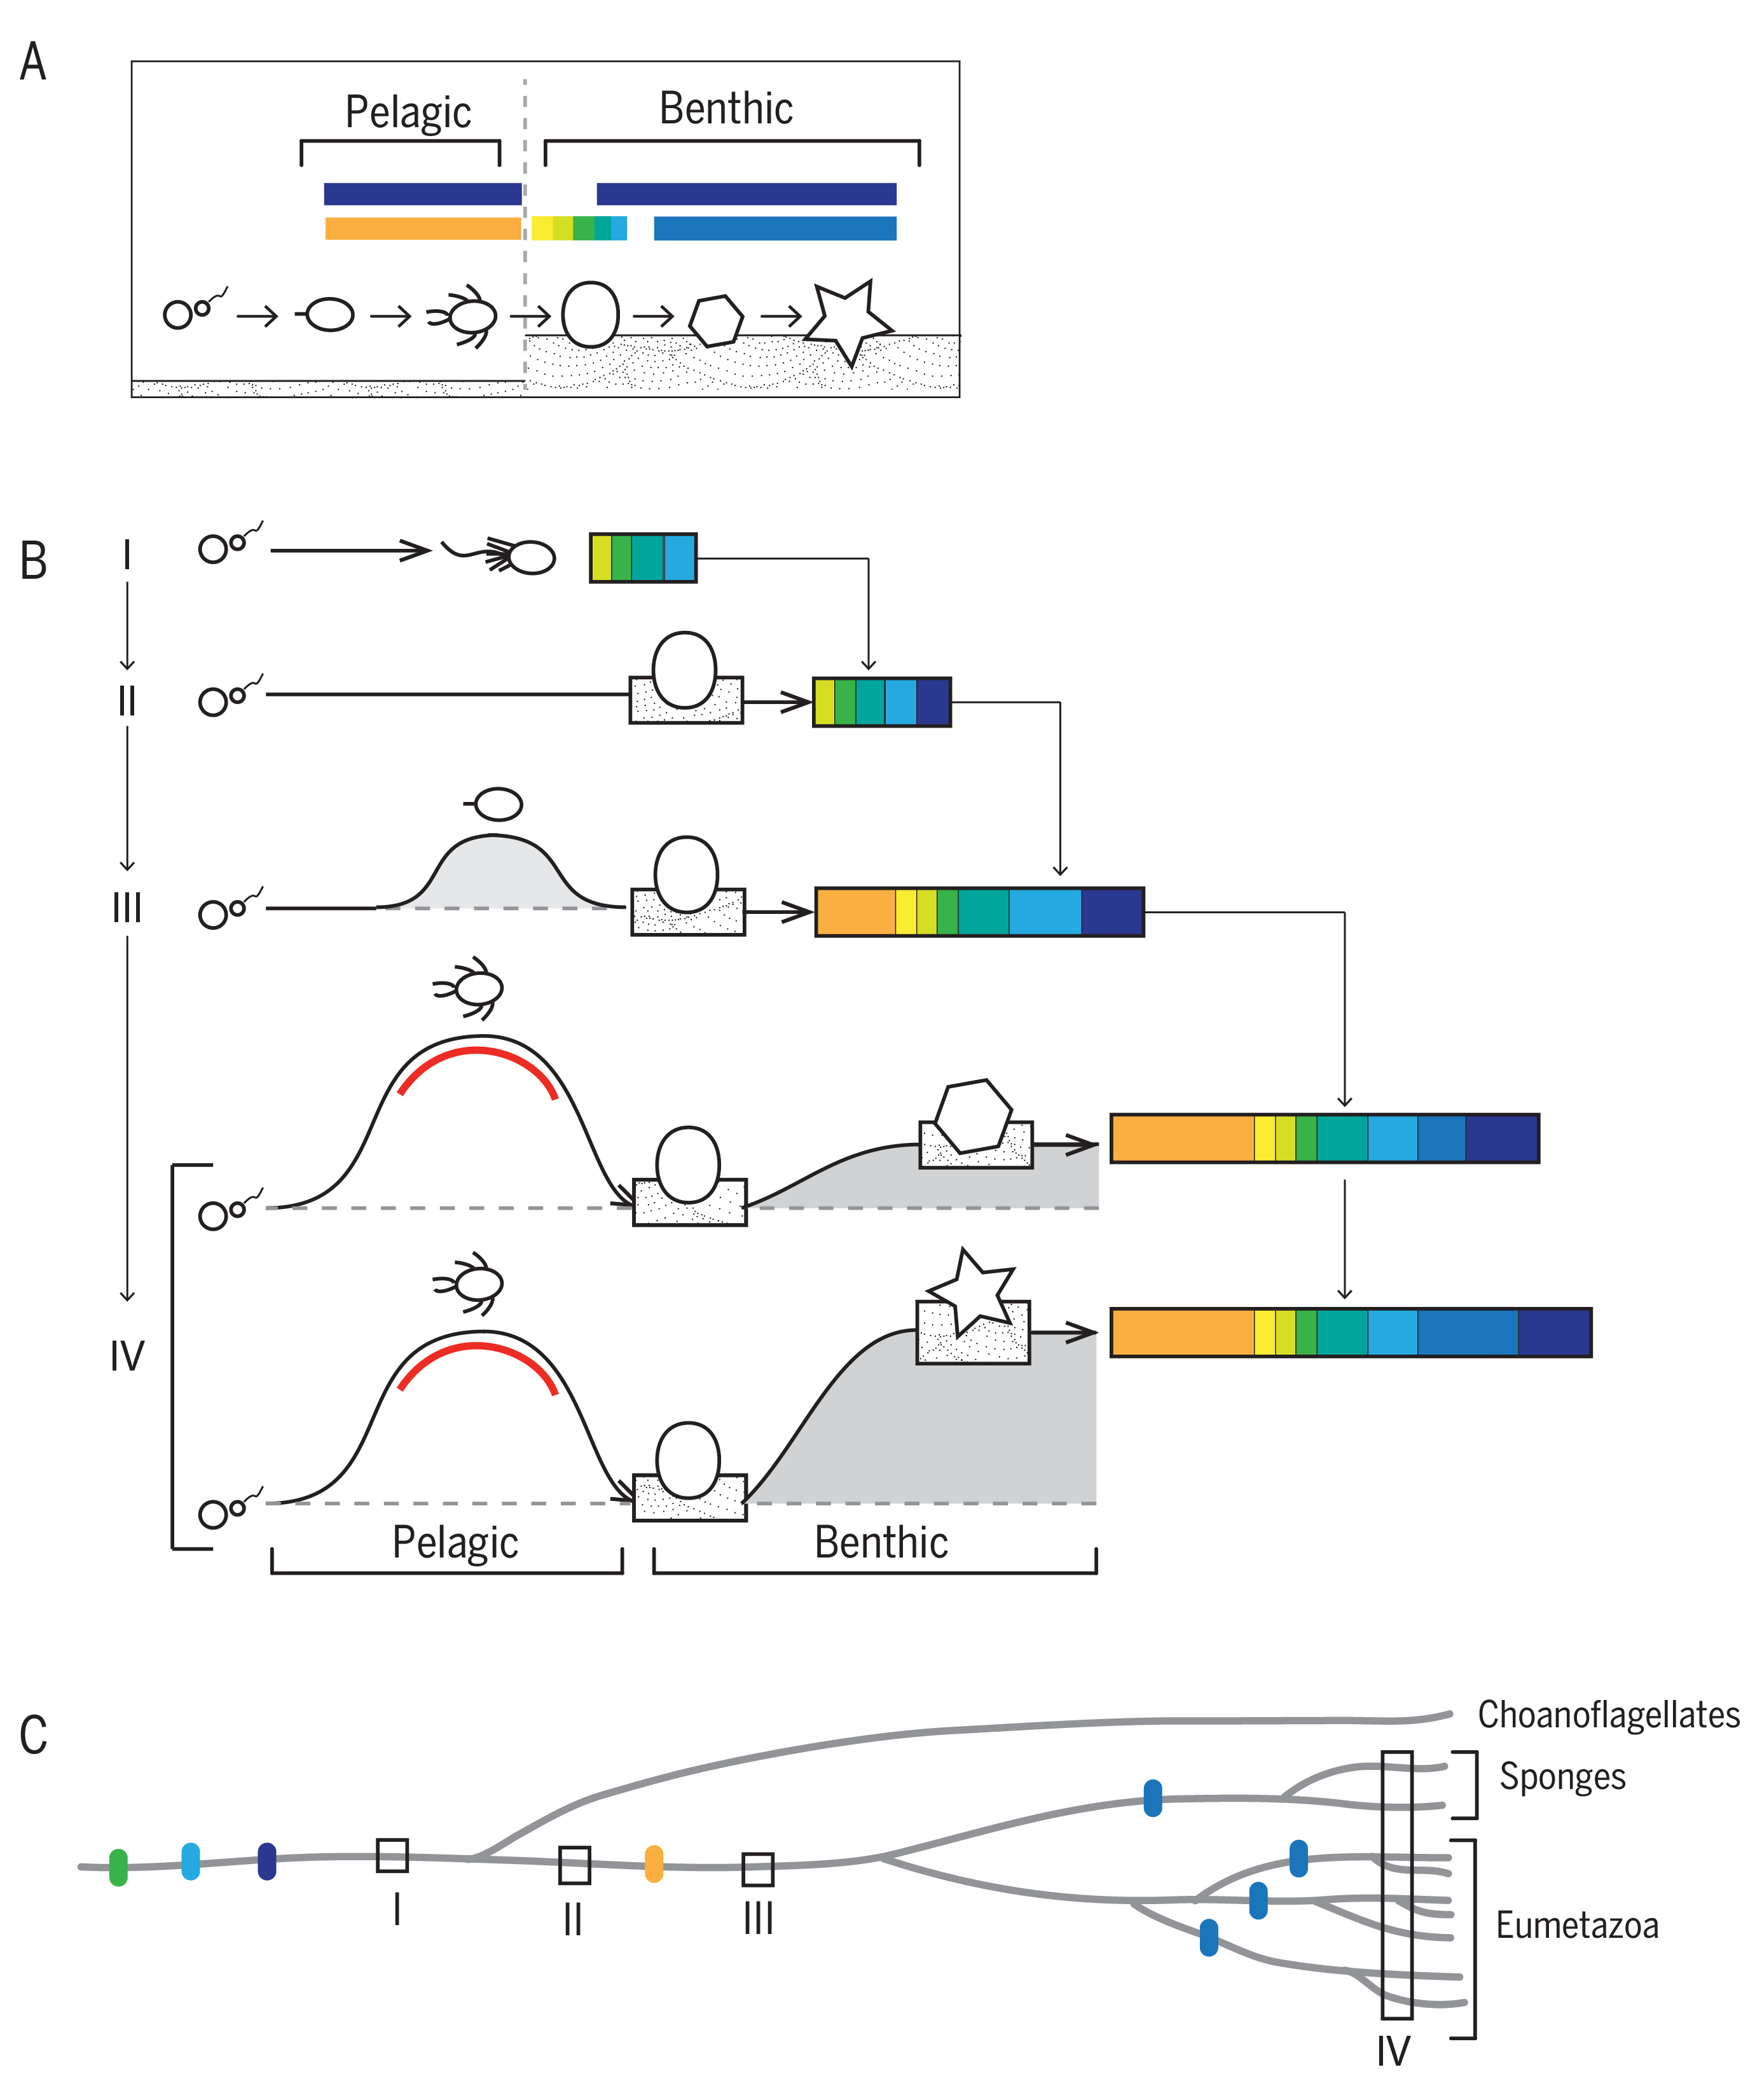
Schematic illustration of a proposed theory for animal life cycle evolution.

Alternate illustration of a proposed theory for animal life cycle evolution.

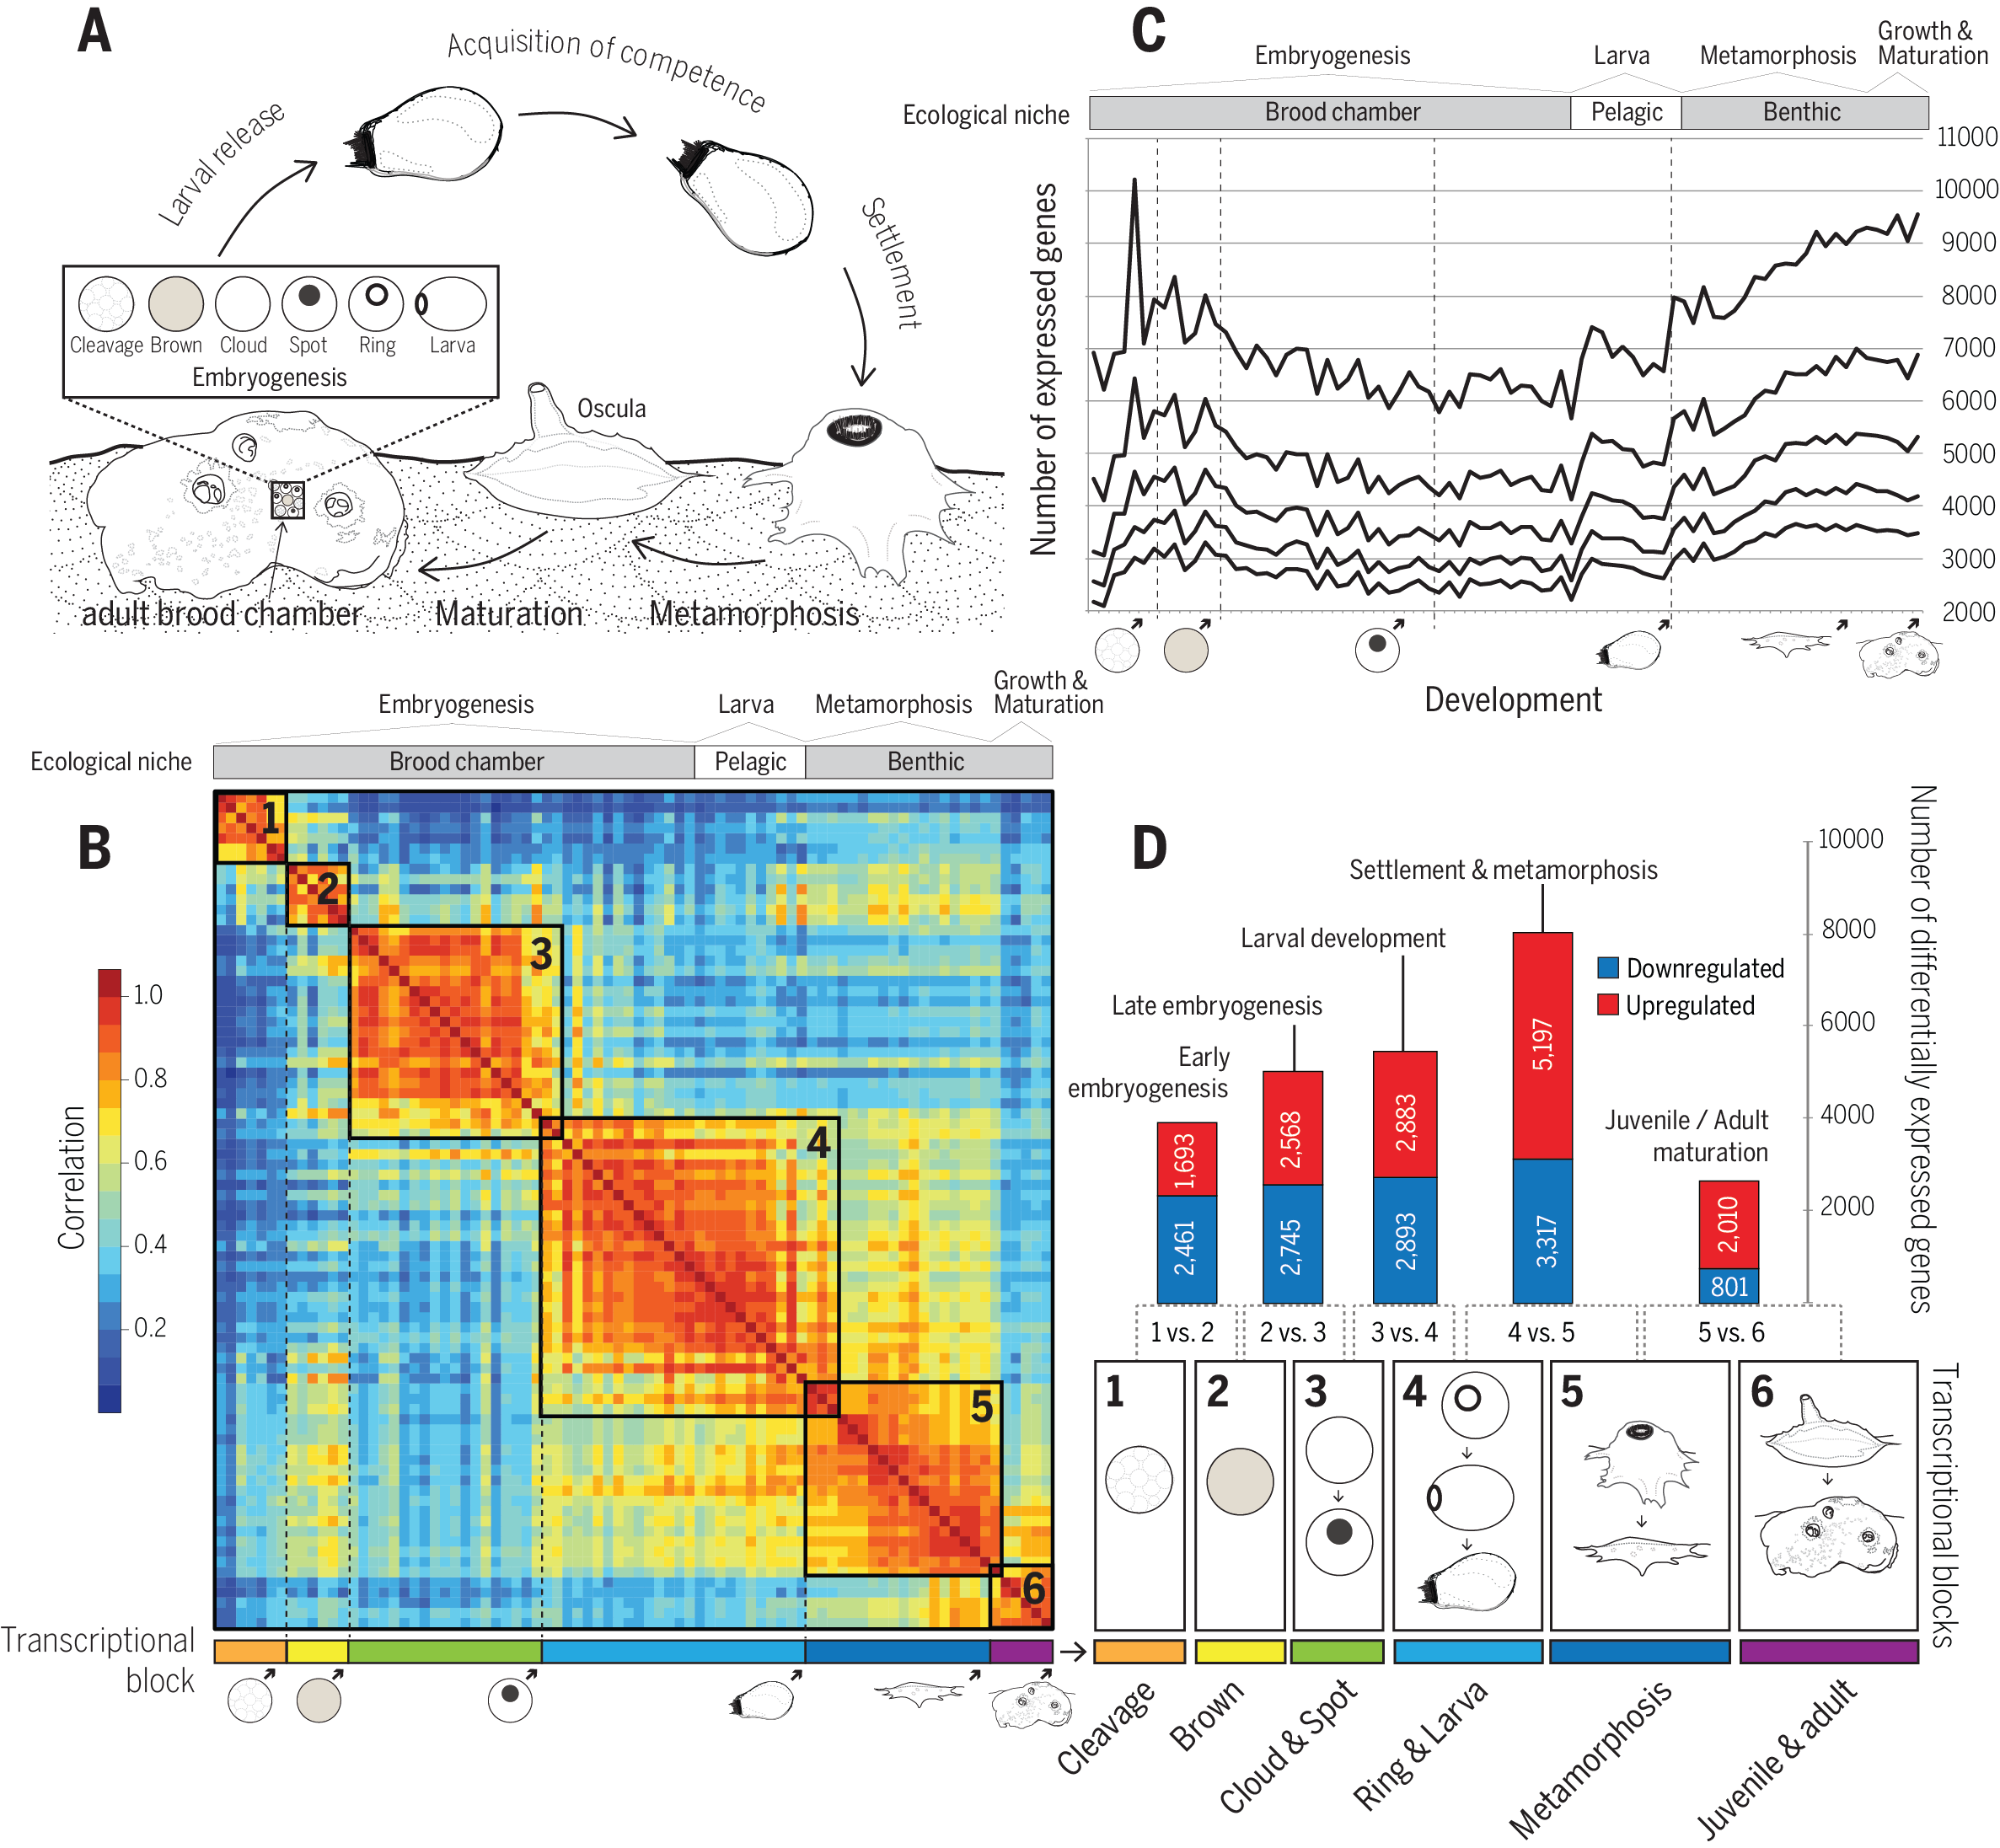
Various genome and transcriptome analyses for the sea sponge, Amphimedon queenslandica.

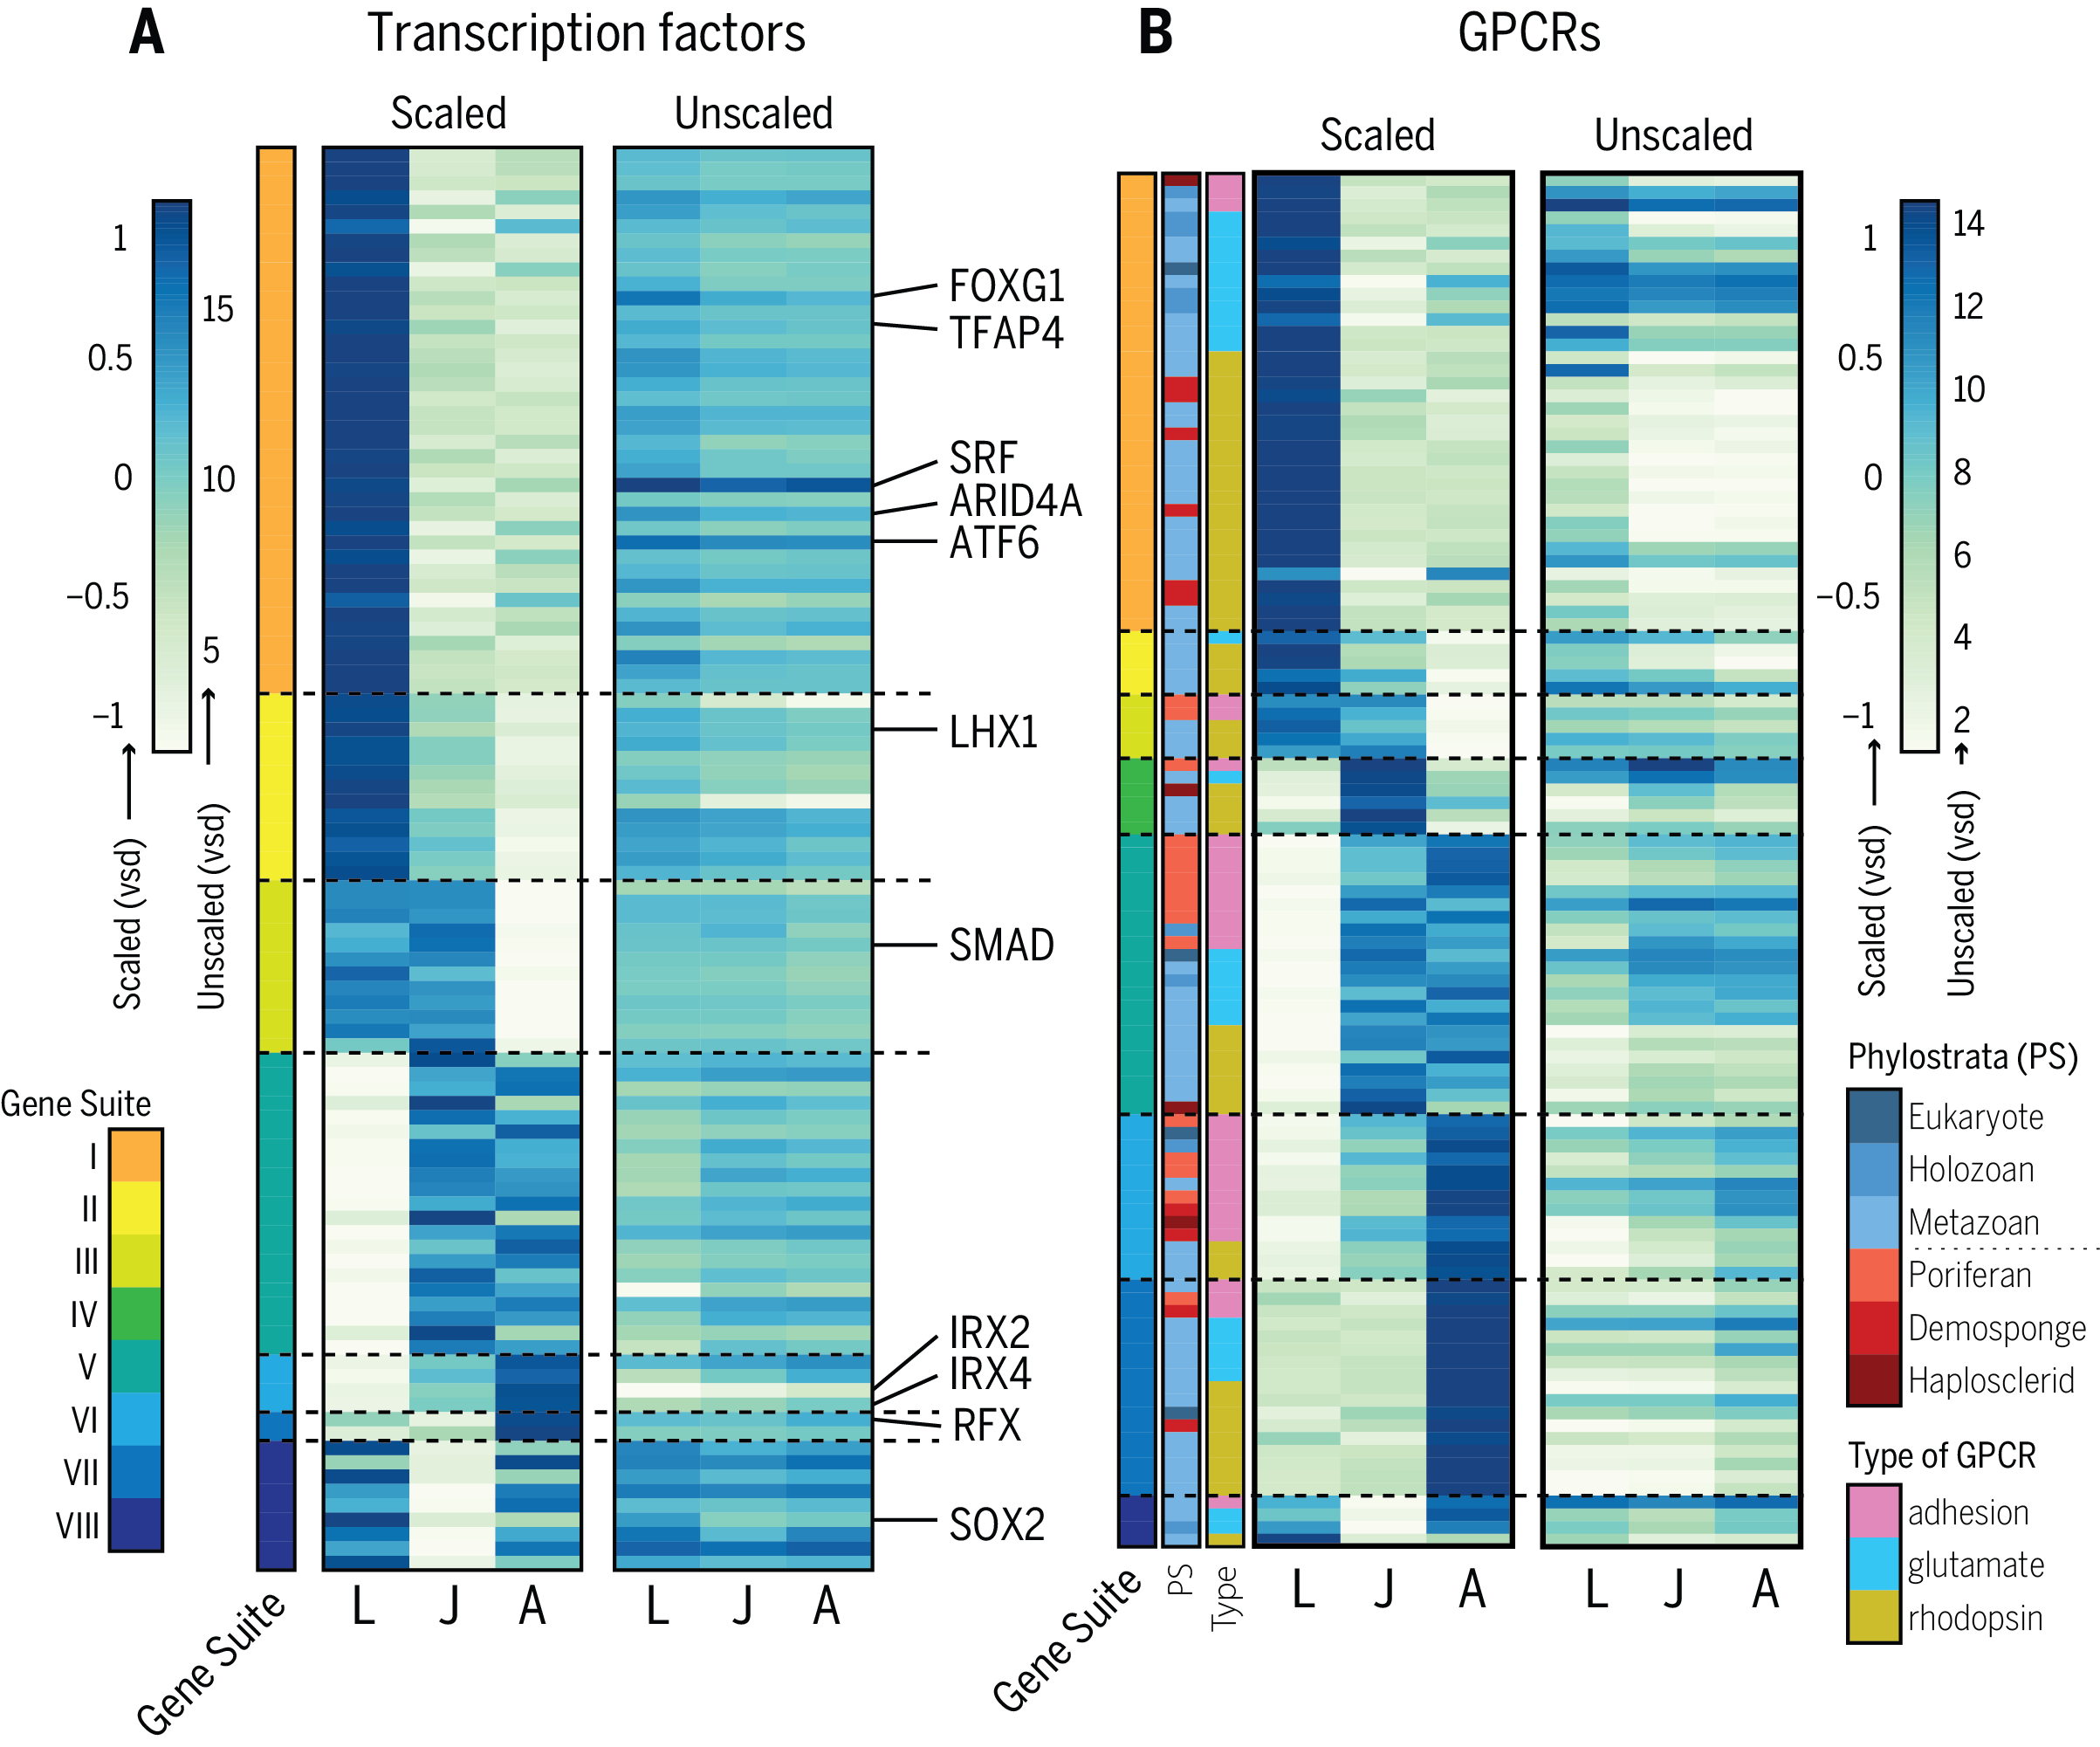
Heatmap illustrating the gene expression profiles of both transcription factors (A) and GPCRs (B) in the sea sponge, Amphimedon queenslandica.
